> ## Documentation Index
> Fetch the complete documentation index at: https://docs.linkutm.com/llms.txt
> Use this file to discover all available pages before exploring further.
# Analytics
> What's tracked, what's surfaced, and how retention works.
Every click on a linkutm short link is logged with details about where the visitor came from, what device they used, and their location. The Analytics page shows this as charts and tables at the workspace level and per individual link.
## What's tracked per click
| What you see | Notes |
| ------------------------- | ------------------------------------------- |
| **Time** | When the click happened |
| **Country, region, city** | Based on the visitor's location |
| **Device** | Mobile, tablet, or desktop |
| **Browser & OS** | Chrome, Safari, iOS, Android, etc. |
| **Referrer** | The site or app that sent them to your link |
## When to use it
* Check workspace-level performance to see which channels are driving the most traffic.
* Open a specific link to debug whether it's working or compare two creative variants.
* Share the workspace analytics view with stakeholders for a channel performance overview.
* Export link data as CSV for client reports or offline analysis (Links → Export).
Pair with a product analytics tool (GA4, Mixpanel, Amplitude) for funnel and conversion data. linkutm shows clicks. Your other tools show what happened after.
## What the Analytics page shows
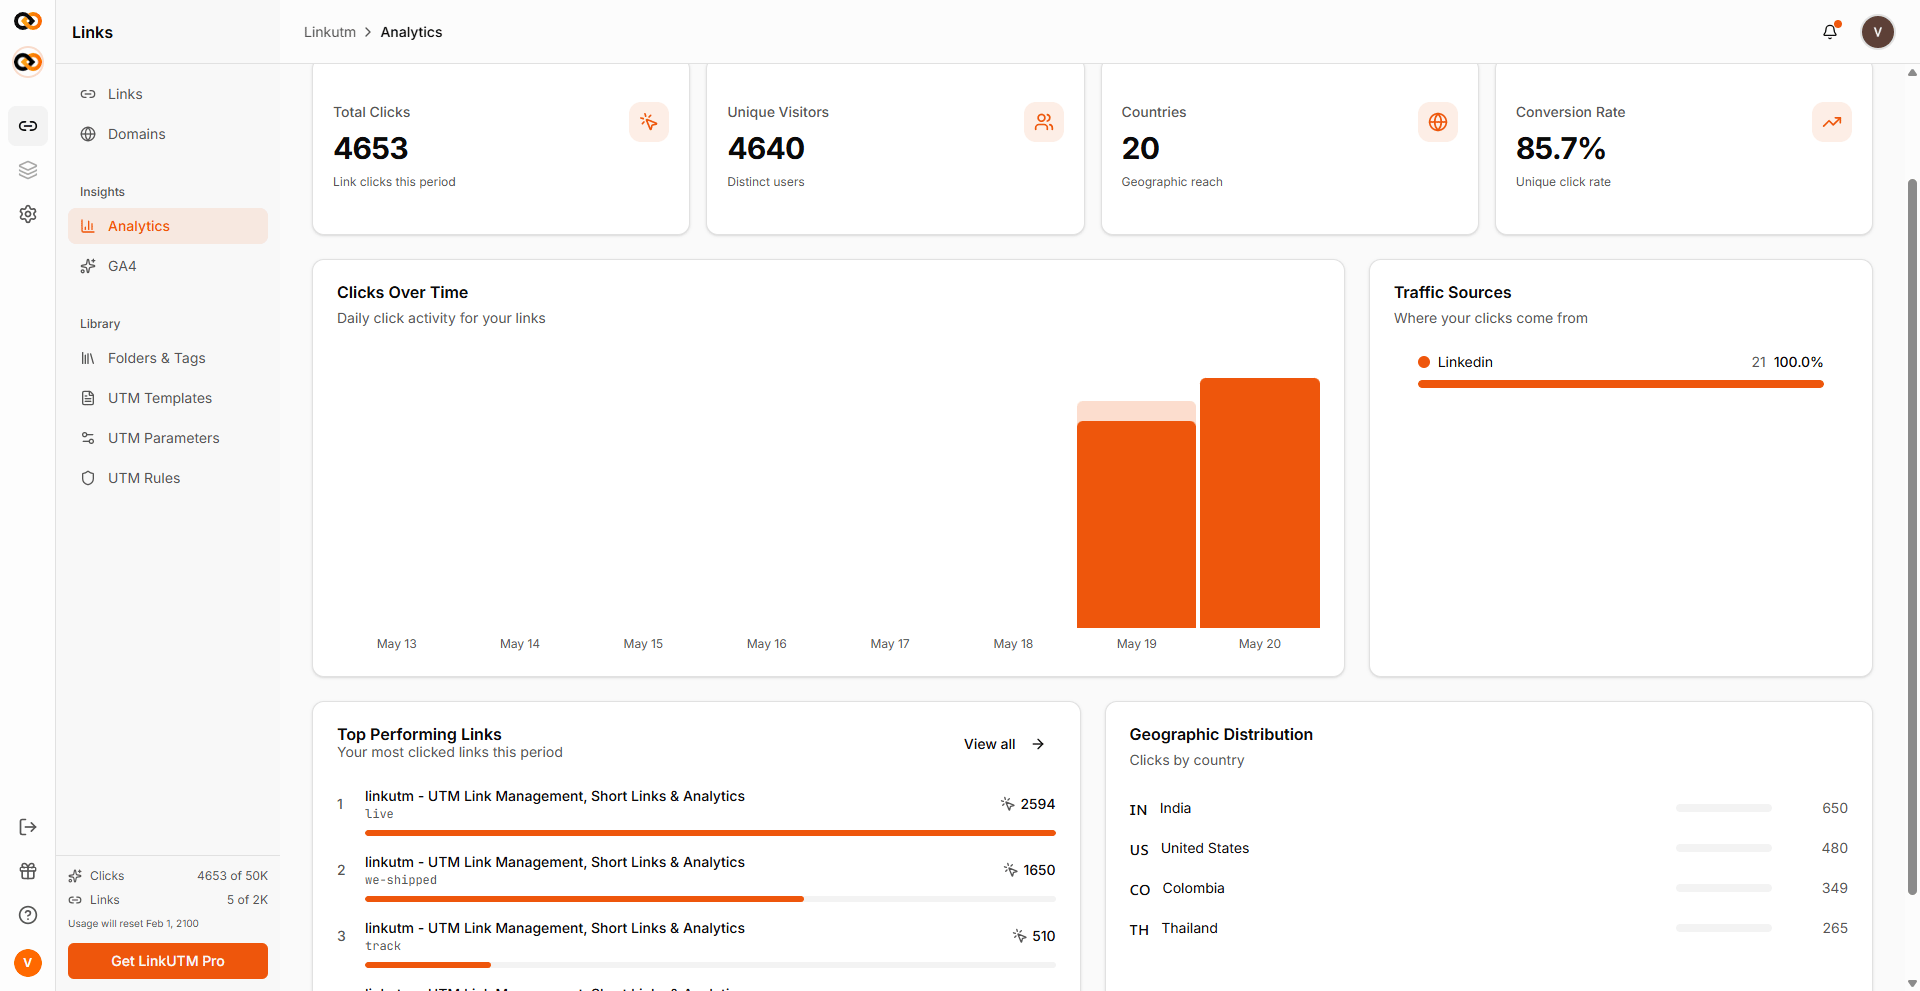
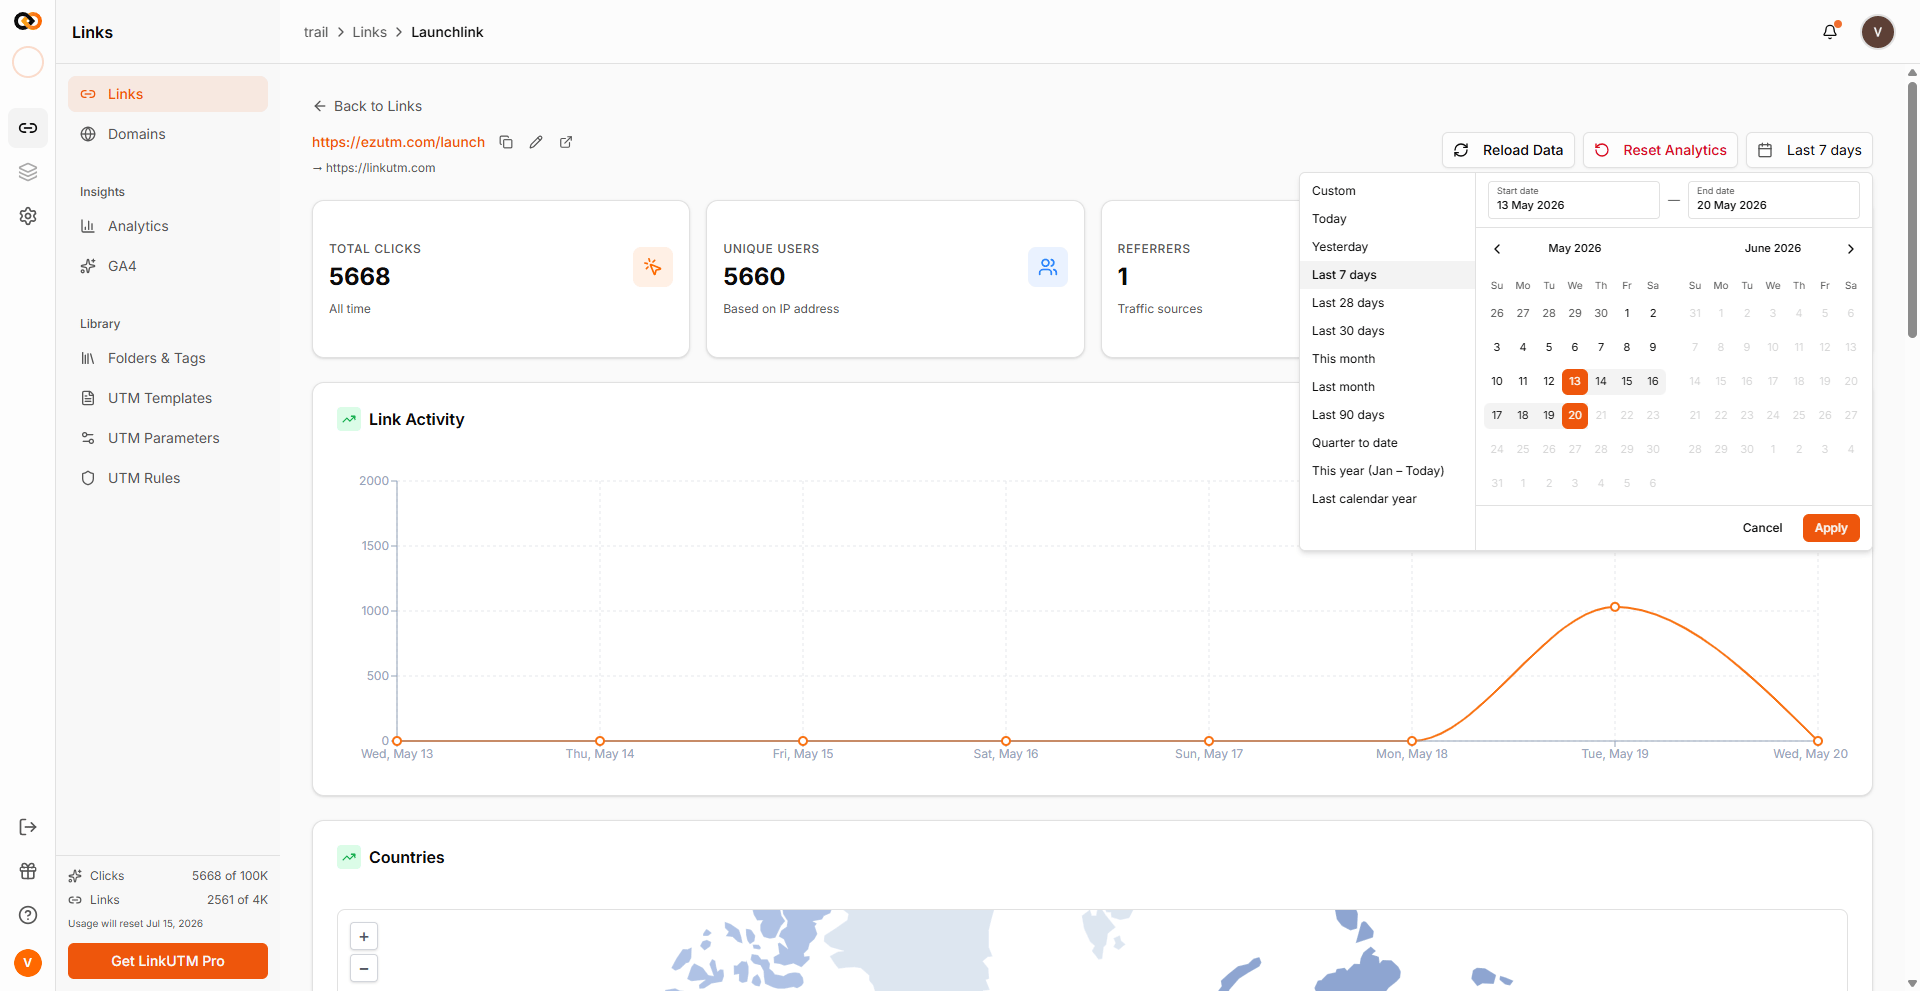
* **Total clicks** in the date window.
* **Unique visitors**.
* **Top links** by click count.
* **Clicks over time**: daily chart.
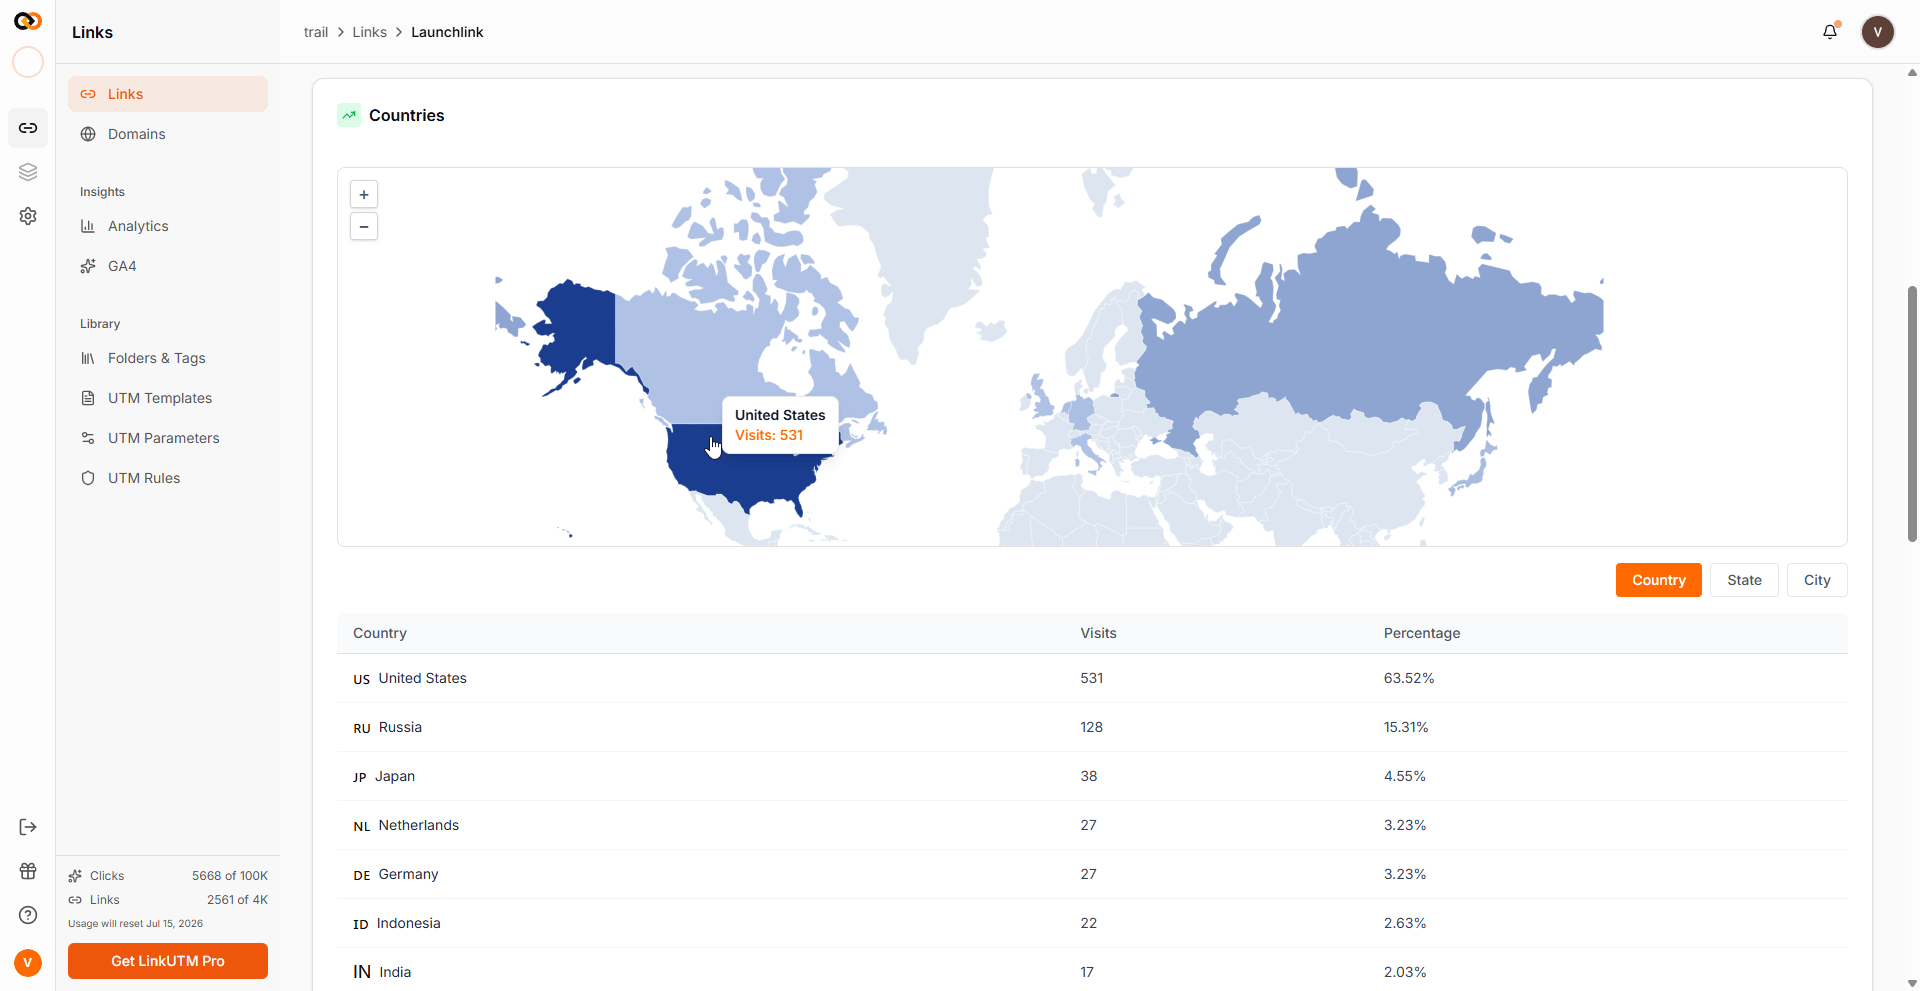
* **Top countries**: bar and map view.
* **Top sources**: by `utm_source` of the originating link.
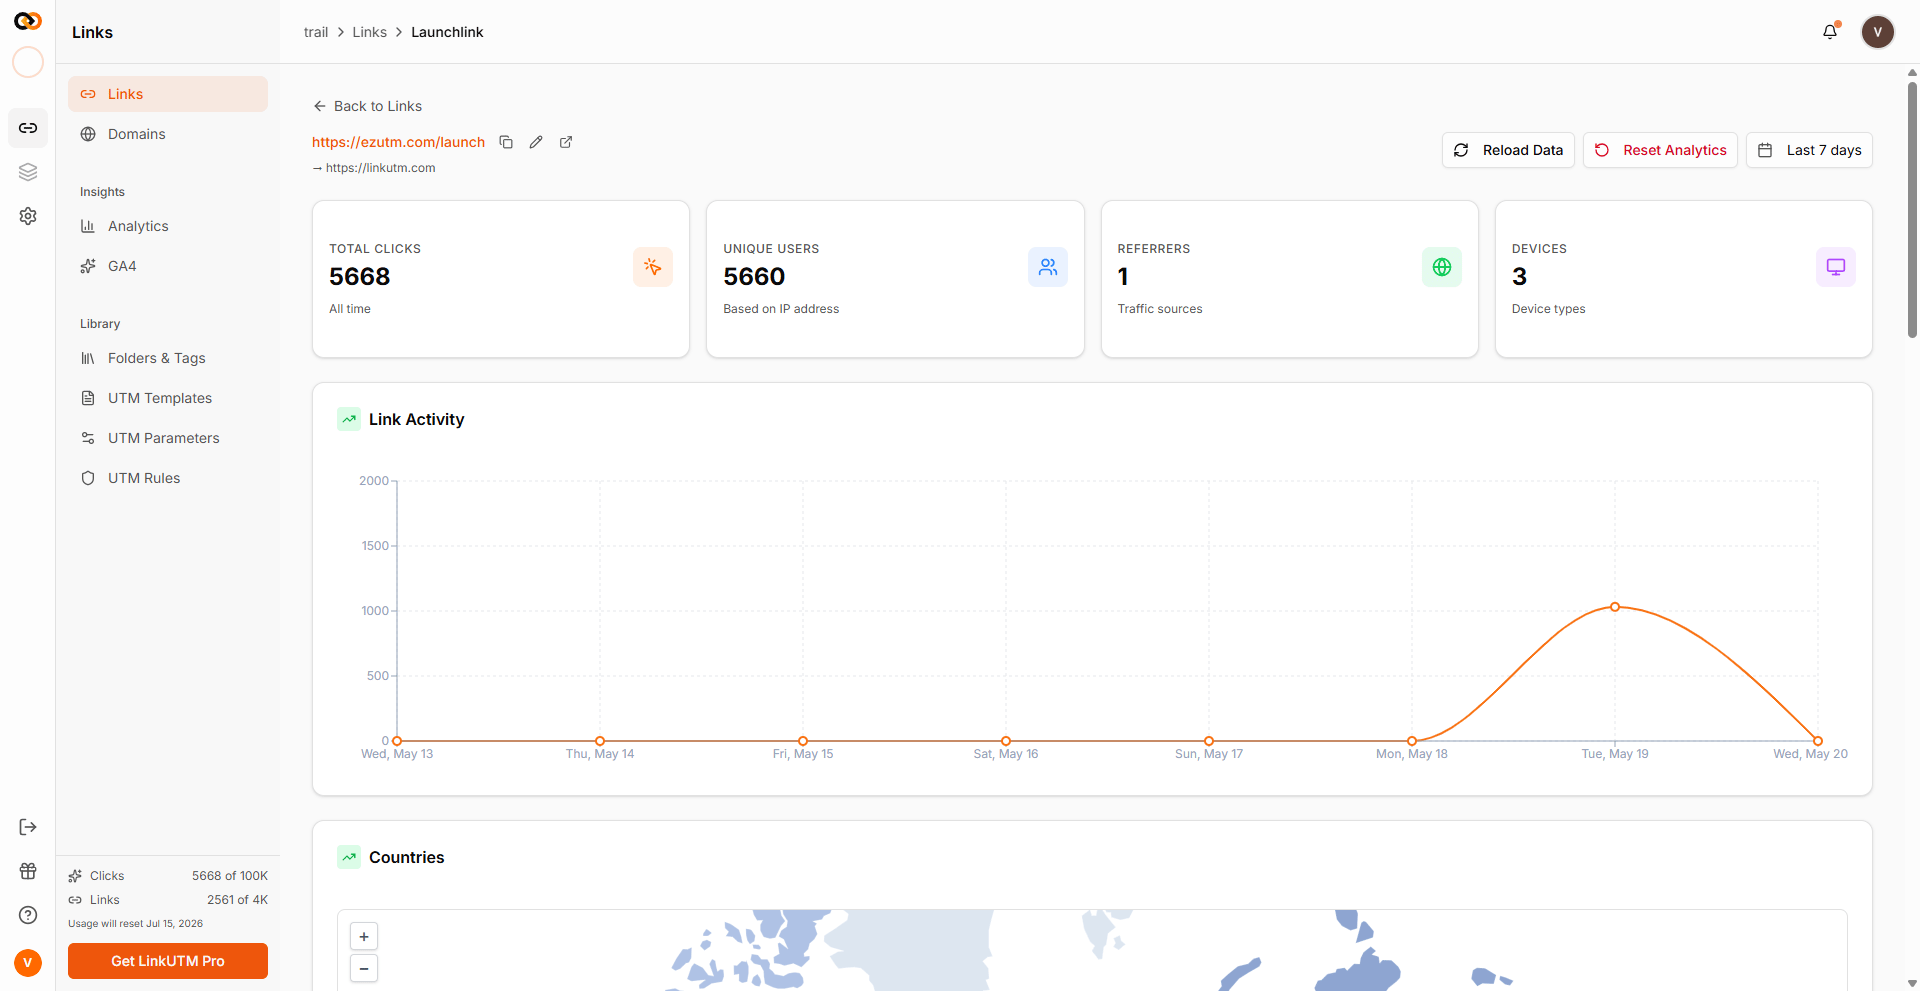
 * **Total clicks** and **unique visitors**.
* **Clicks over time**: daily chart.
* **Top countries, regions, cities**.
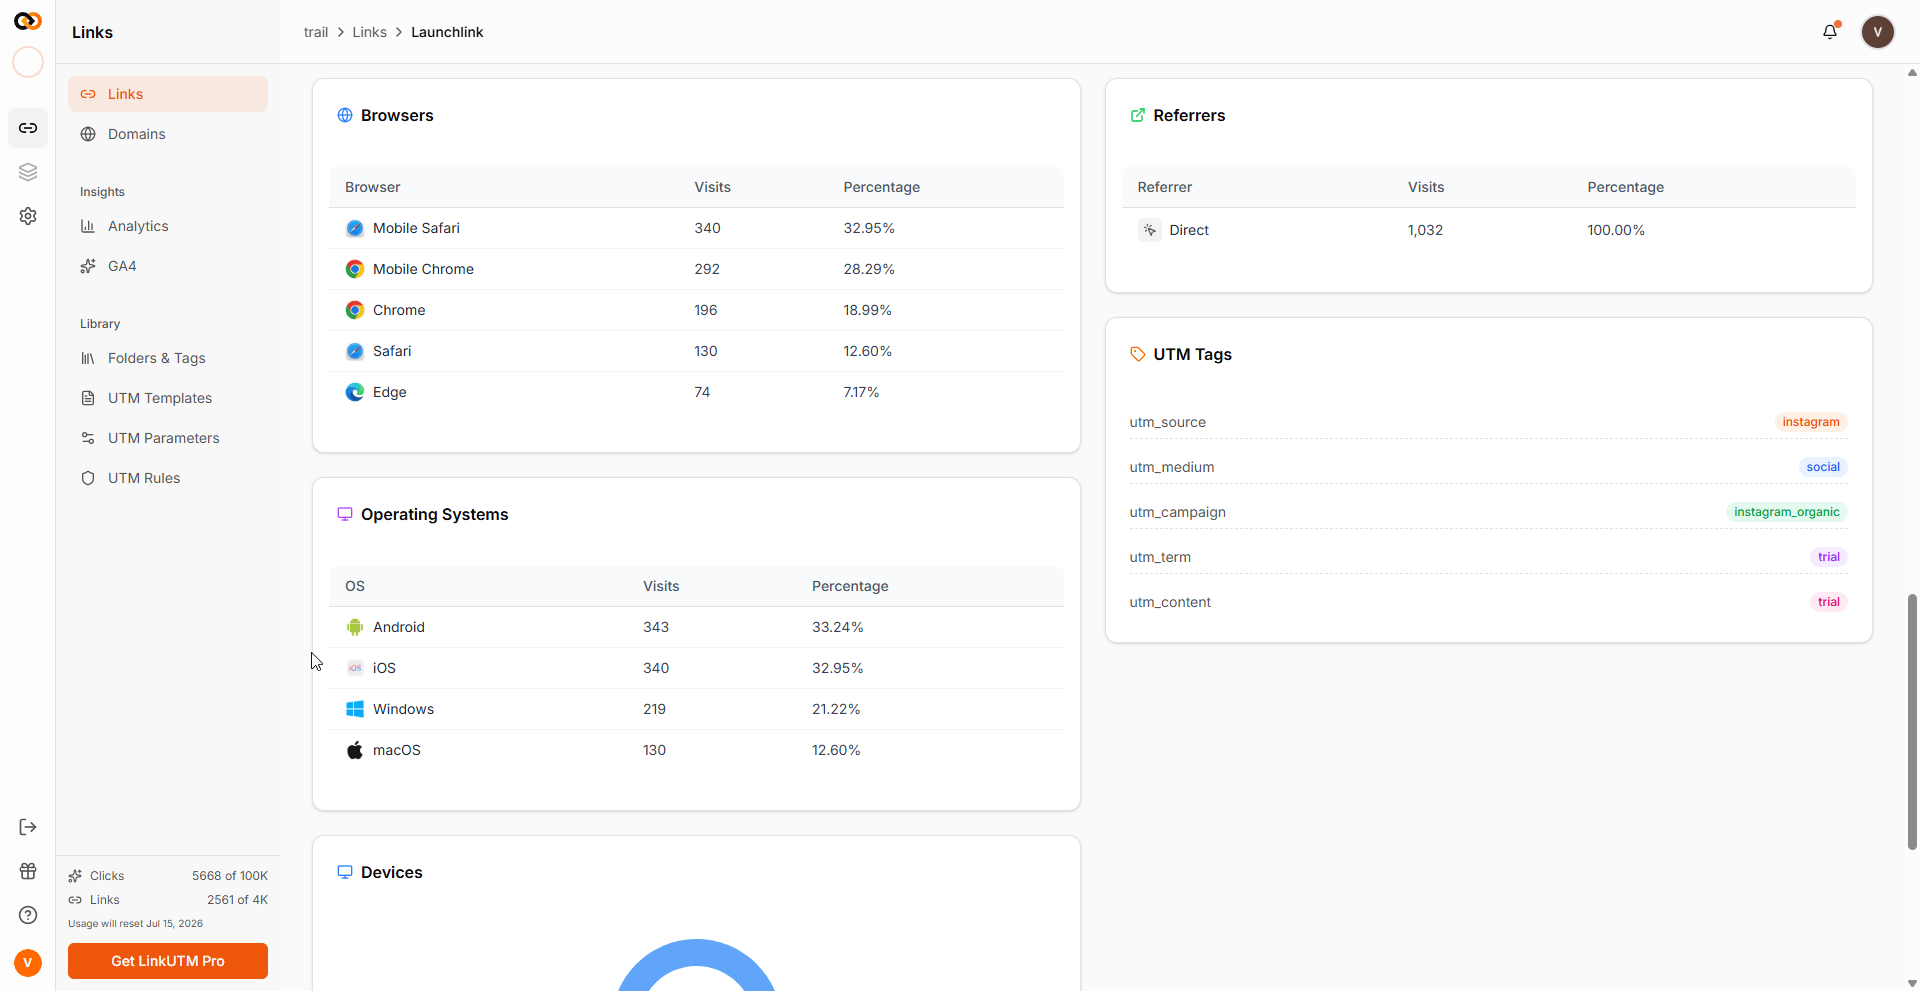
* **Top referrers**.
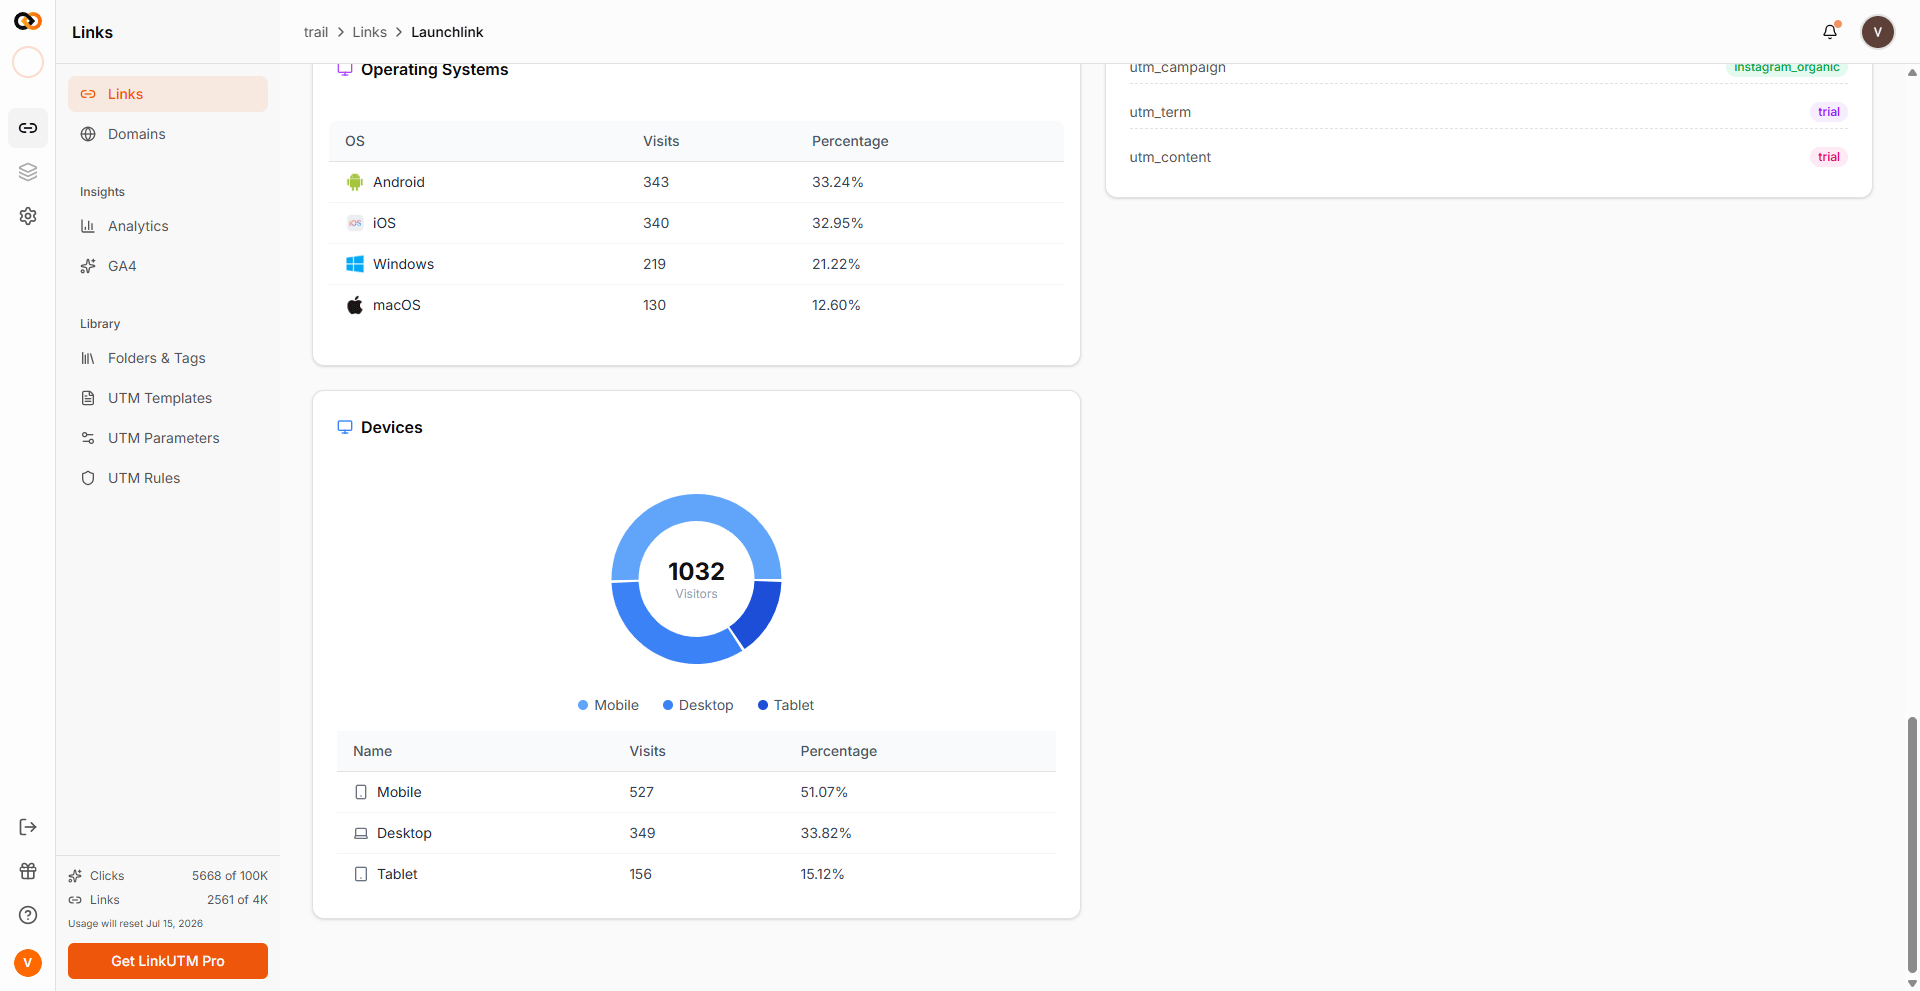
* **Device, browser, and OS breakdown**.
* **Total clicks** and **unique visitors**.
* **Clicks over time**: daily chart.
* **Top countries, regions, cities**.
* **Top referrers**.
* **Device, browser, and OS breakdown**.
 ## Real-world example
After a Q2 launch:
```
Workspace analytics, last 30 days:
- 18,420 clicks across 24 links
- 11,238 unique visitors
- Top source: google (cpc) - 8.3k clicks
- Top country: US - 12.1k
- Top device: mobile - 11.2k
Per-link: q2-launch-google
- 8,302 clicks
- 73% mobile, 24% desktop, 3% tablet
- Top referrer: Direct (typed/QR/in-app browser)
- Top country: US 71%, UK 9%, CA 6%
```
This tells the marketer: Google Ads drove most volume, mostly mobile, mostly US. Optimize the landing page for mobile US and consider expanding the UK budget.
## Real-world example
After a Q2 launch:
```
Workspace analytics, last 30 days:
- 18,420 clicks across 24 links
- 11,238 unique visitors
- Top source: google (cpc) - 8.3k clicks
- Top country: US - 12.1k
- Top device: mobile - 11.2k
Per-link: q2-launch-google
- 8,302 clicks
- 73% mobile, 24% desktop, 3% tablet
- Top referrer: Direct (typed/QR/in-app browser)
- Top country: US 71%, UK 9%, CA 6%
```
This tells the marketer: Google Ads drove most volume, mostly mobile, mostly US. Optimize the landing page for mobile US and consider expanding the UK budget.
 ## Common mistakes
A click is not a sale, signup, or page view. Pair with GA4 or Mixpanel using the UTMs attached to your links for downstream events.
Platforms like Slack and WhatsApp automatically fetch link previews when someone pastes a URL. These preview fetches are filtered out and not counted as clicks.
Each workspace has a data retention window. Queries for older data are automatically cut off at the start of the window.
## Edge cases
**Retention window.** Queries are capped to your plan's retention window. Data older than the window is not returned.
## Common mistakes
A click is not a sale, signup, or page view. Pair with GA4 or Mixpanel using the UTMs attached to your links for downstream events.
Platforms like Slack and WhatsApp automatically fetch link previews when someone pastes a URL. These preview fetches are filtered out and not counted as clicks.
Each workspace has a data retention window. Queries for older data are automatically cut off at the start of the window.
## Edge cases
**Retention window.** Queries are capped to your plan's retention window. Data older than the window is not returned.