What it is
Every click on a linkutm short URL is logged with rich context. The Analytics page surfaces aggregations at workspace and per-link level.What’s tracked per click
Every click captures:| What you see | Notes |
|---|---|
| Time | When the click happened |
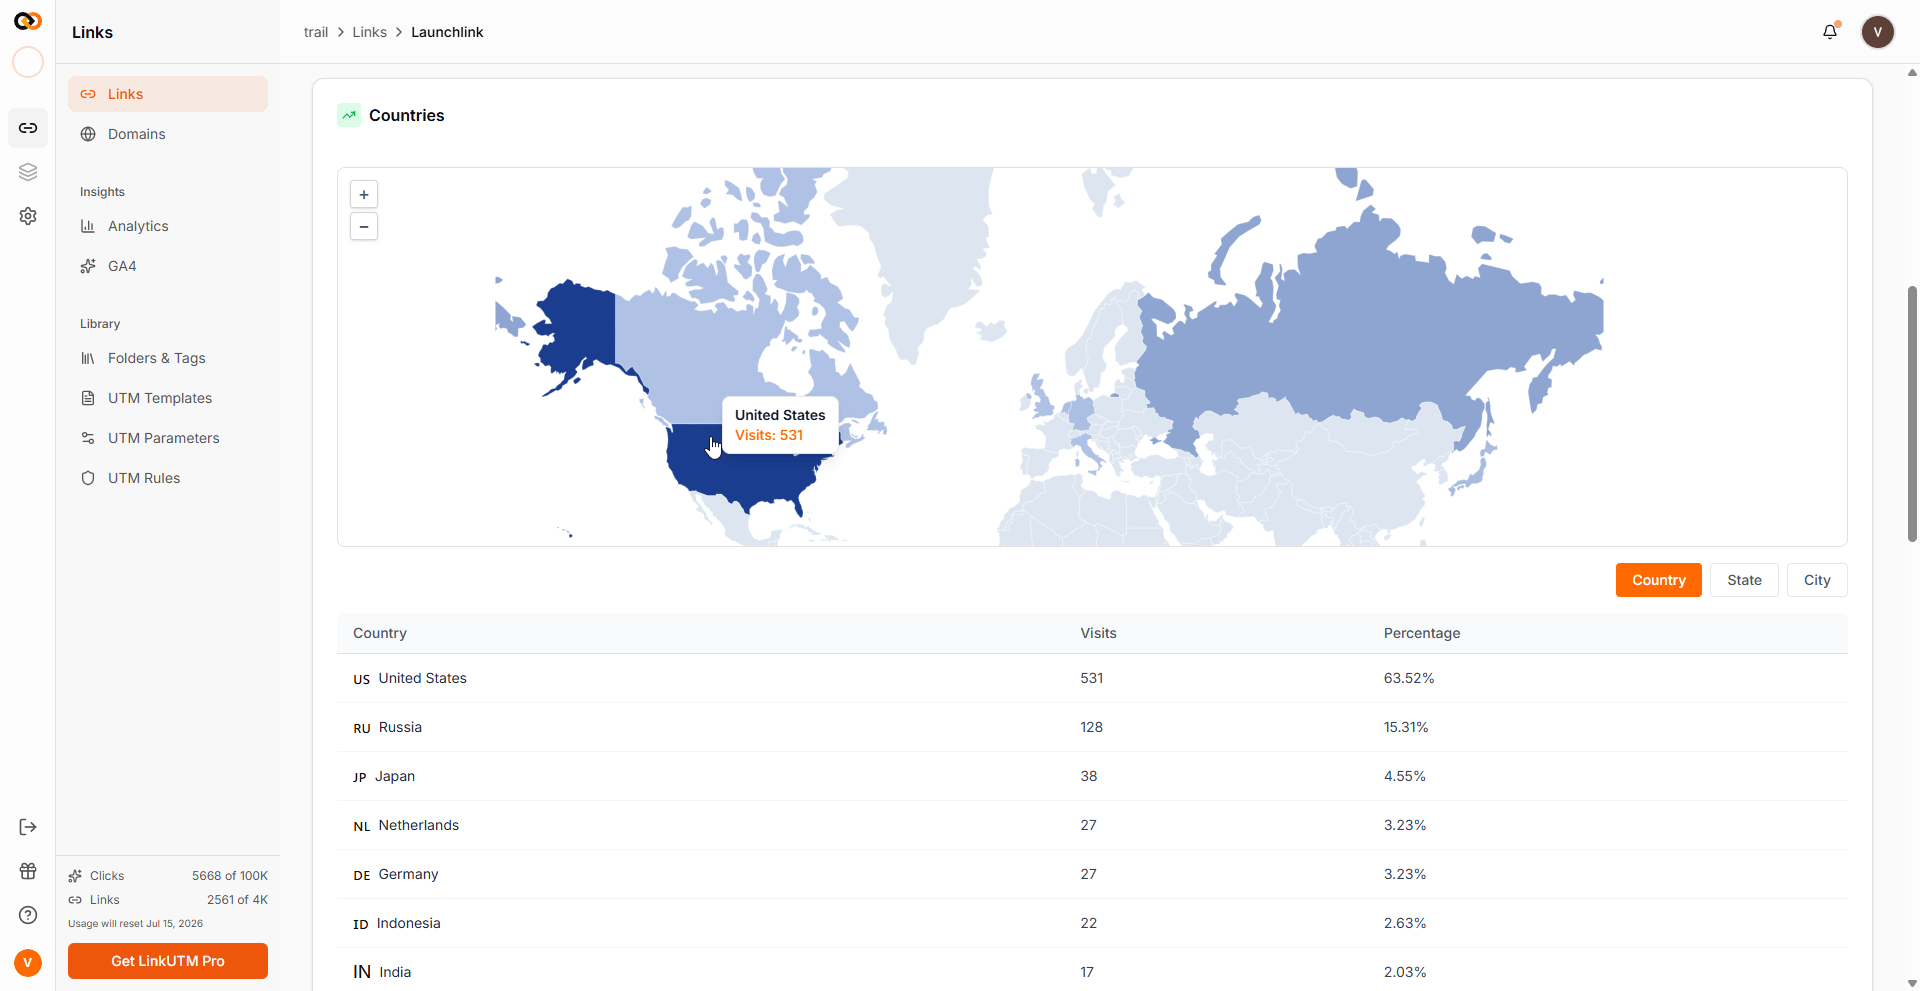
| Country, region, city | Based on the visitor’s IP address |
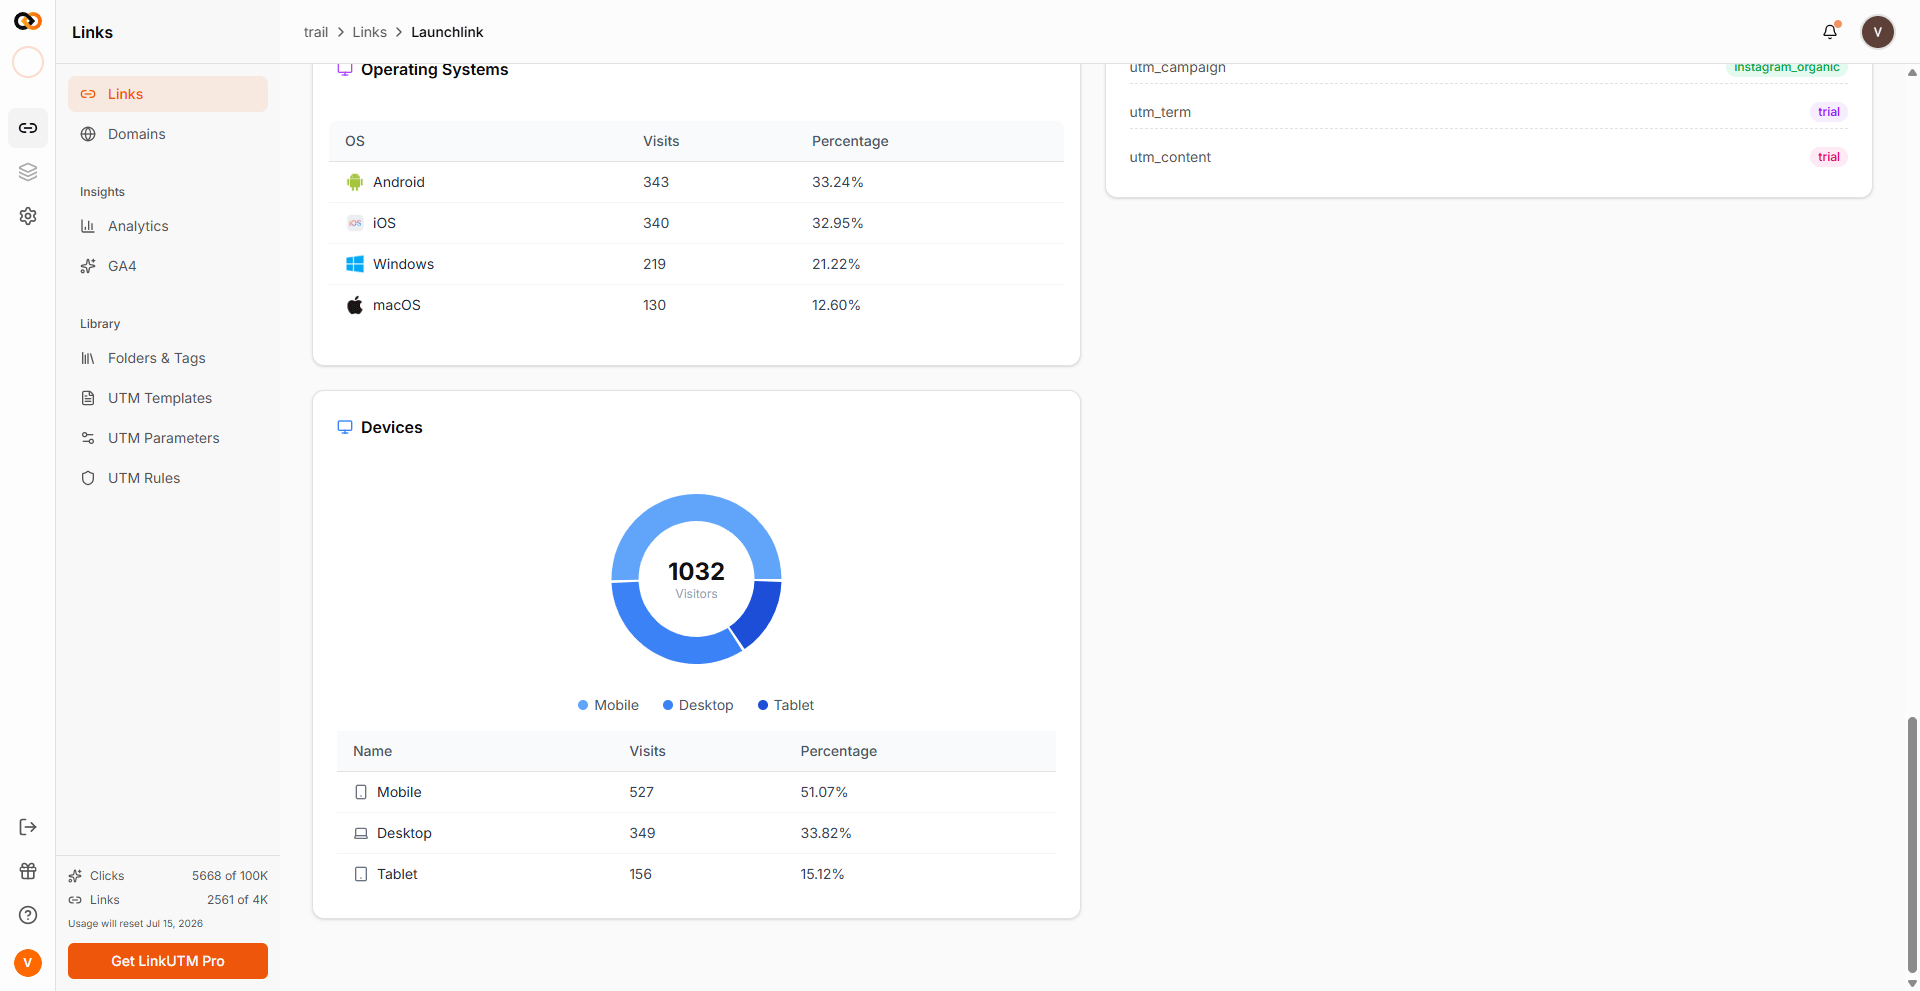
| Device | Mobile, tablet, or desktop |
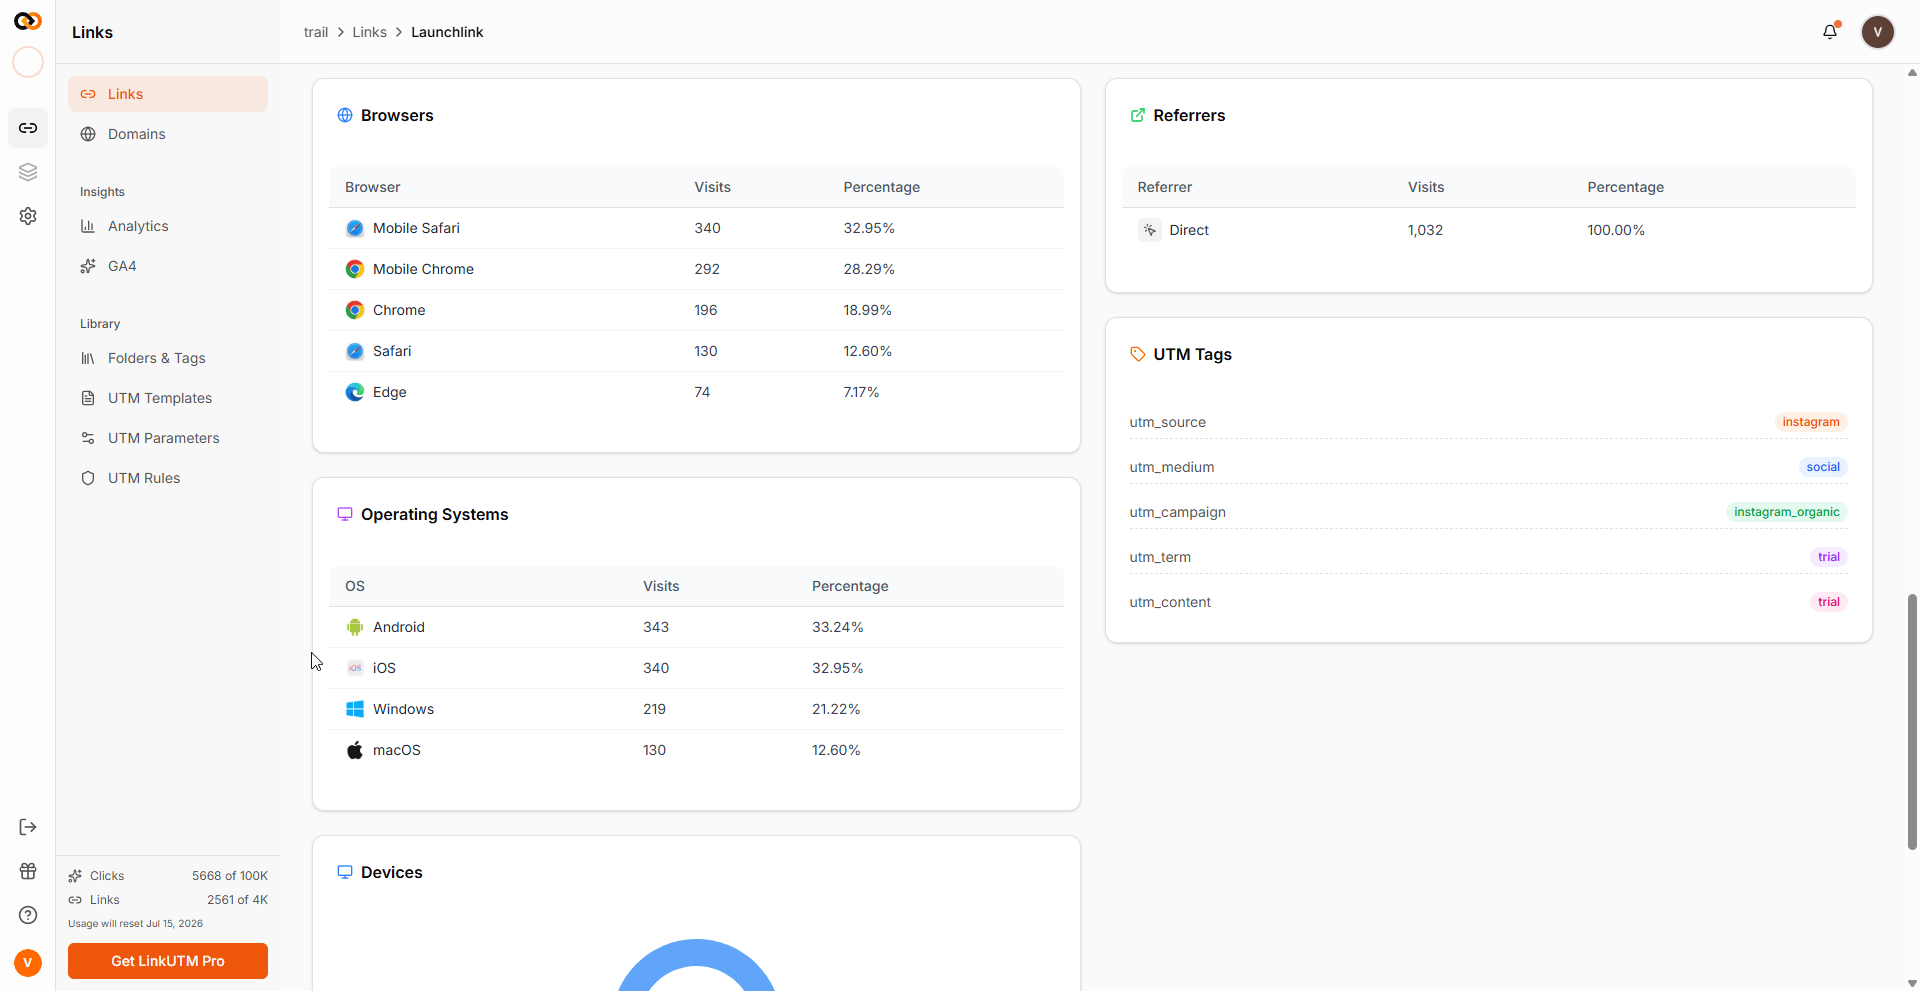
| Browser & OS | Chrome, Safari, iOS, Android, etc. |
| Referrer | Where they came from — the site or app that sent them to your link |
When to use it
- Daily - see clicks over time at a glance.
- Per-link - debug “is this link working” or compare creative variants.
- Workspace-level - channel mix, top performing links, top countries, top sources.
What the Analytics page shows
- Workspace view
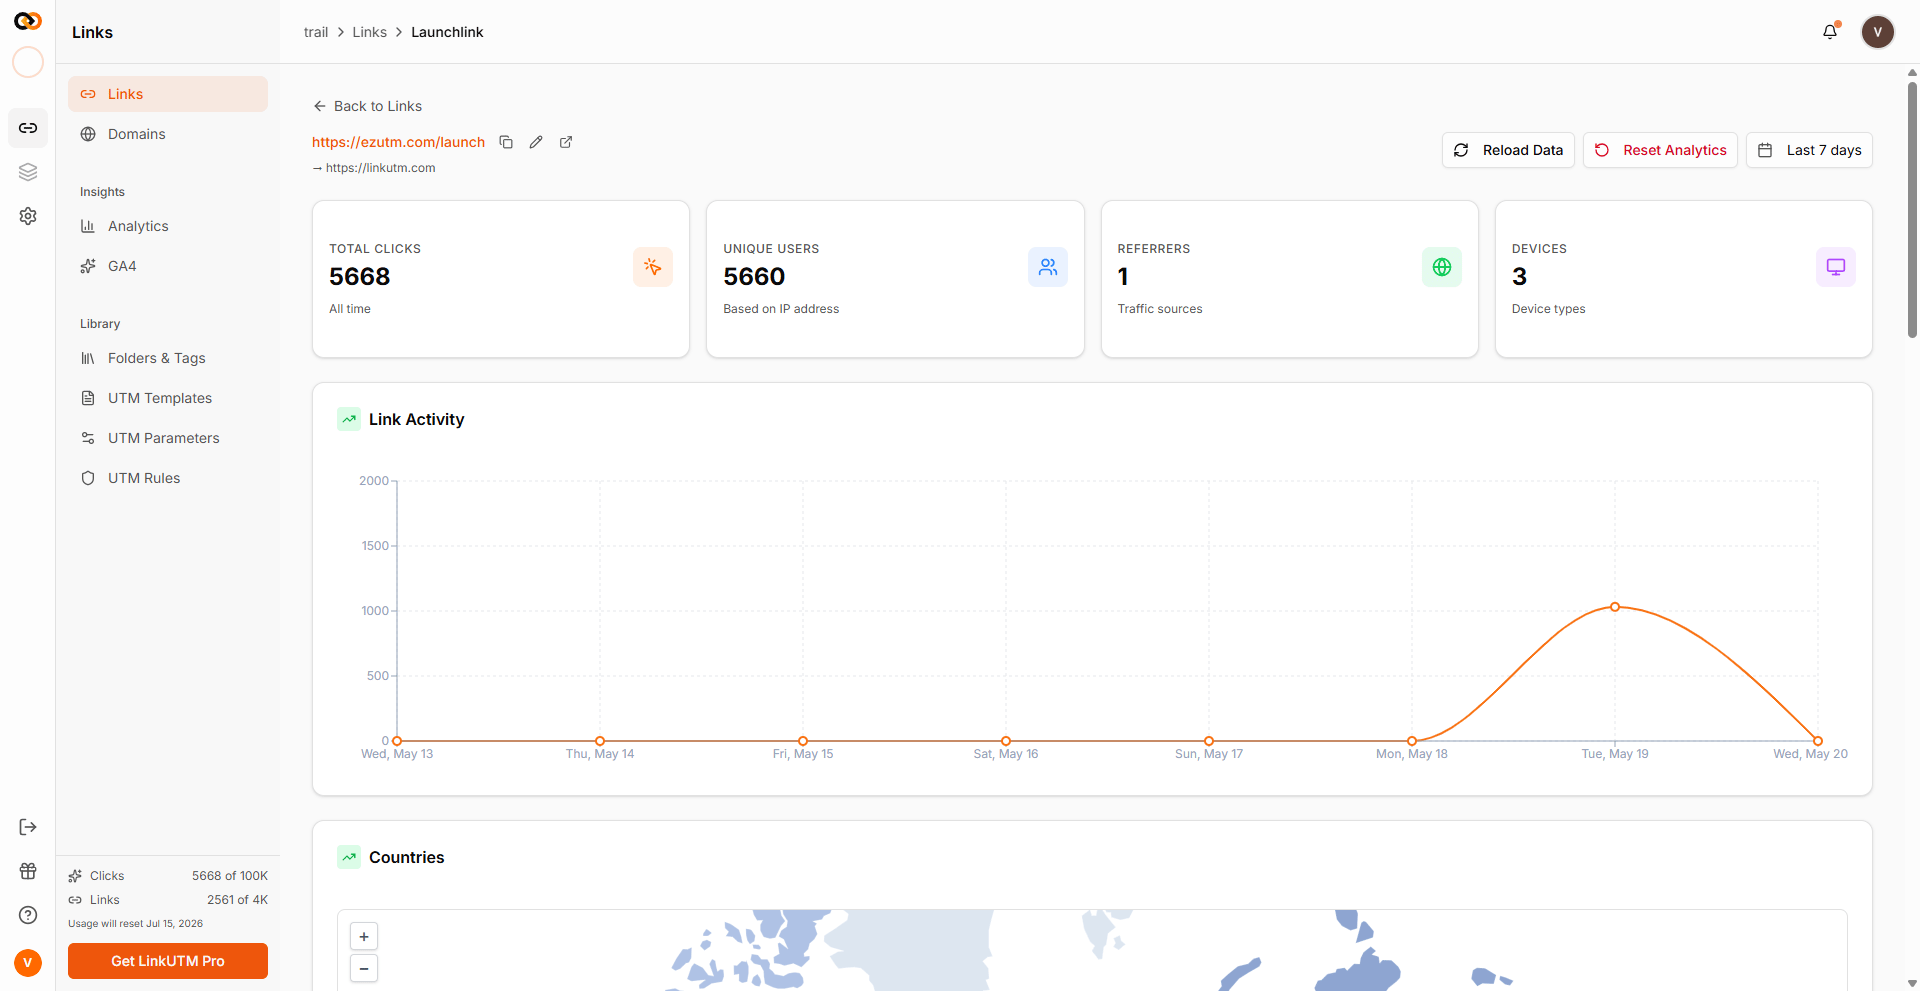
- Per-link view
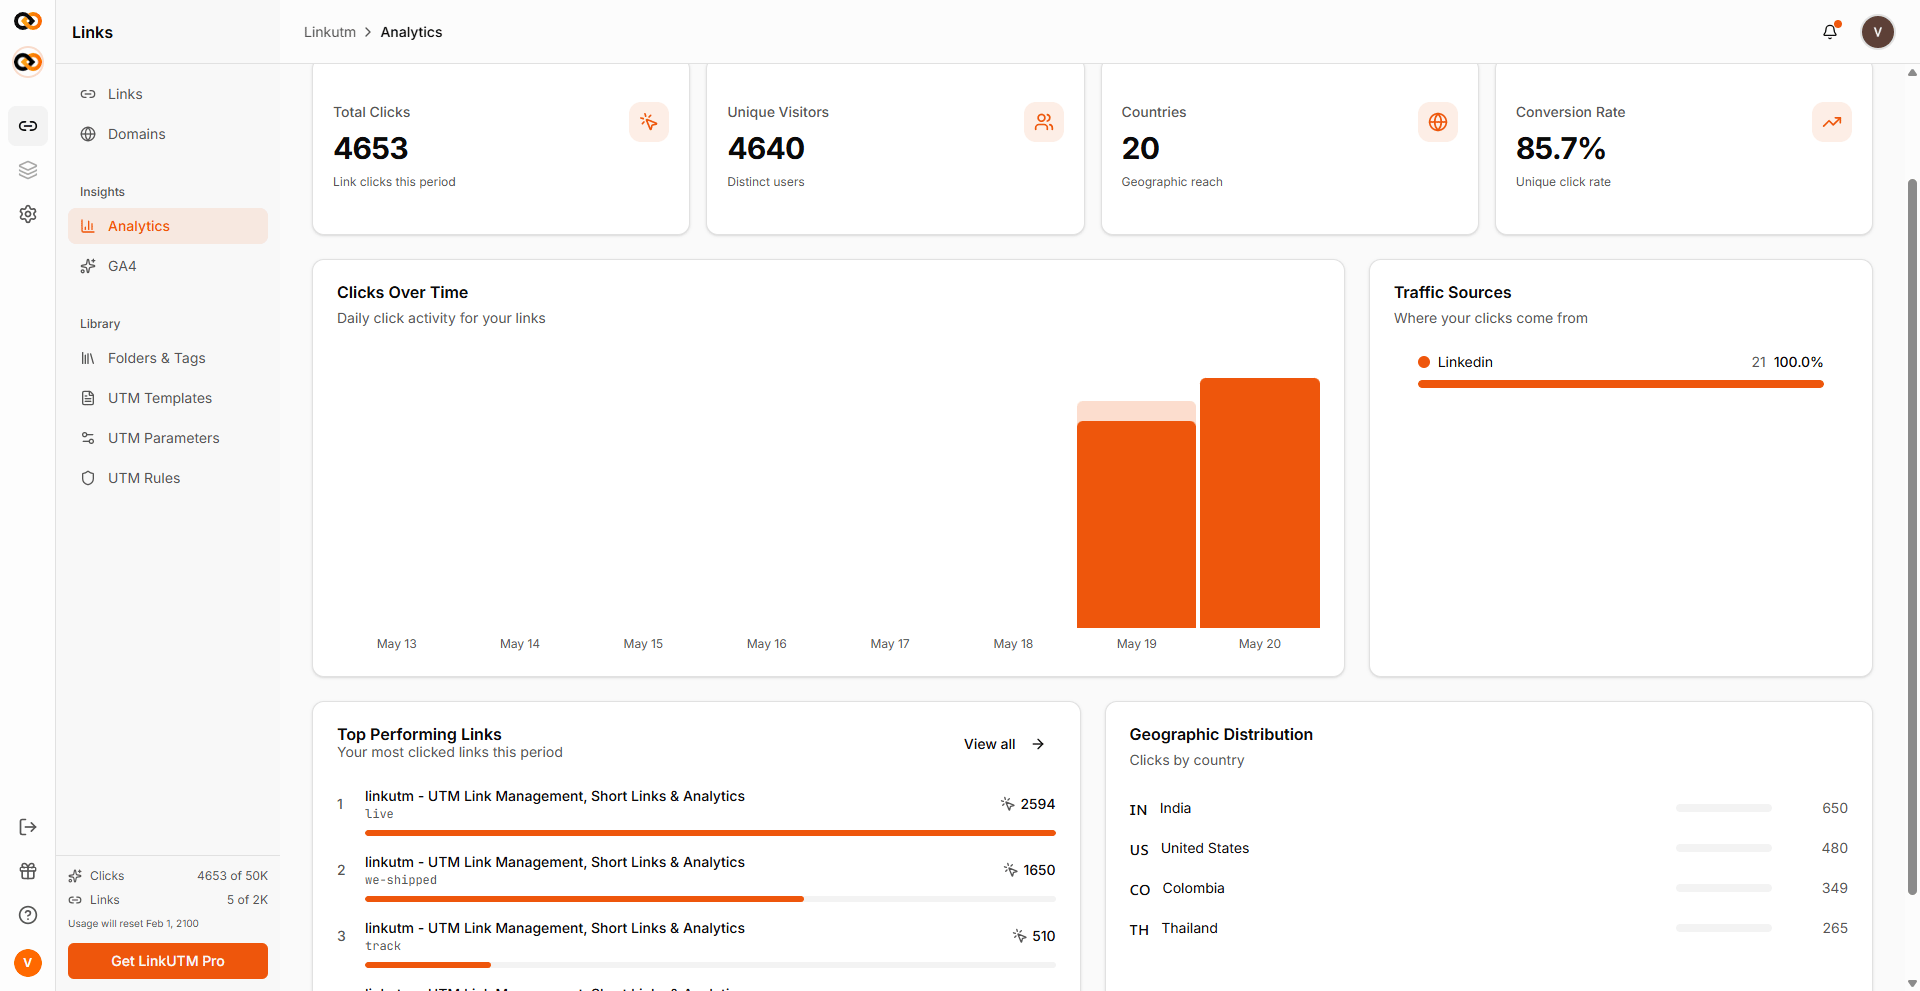
- Total clicks in the date window.
- Unique visitors (distinct IPs).
- Conversion rate = unique / total clicks (rough proxy).
- Top links by click count.
- Clicks over time - daily series, fills 0 for empty days.
- Top countries - bar / map visualization.
- Top sources - by
utm_sourceof the originating link.
Real-world example
After a Q2 launch: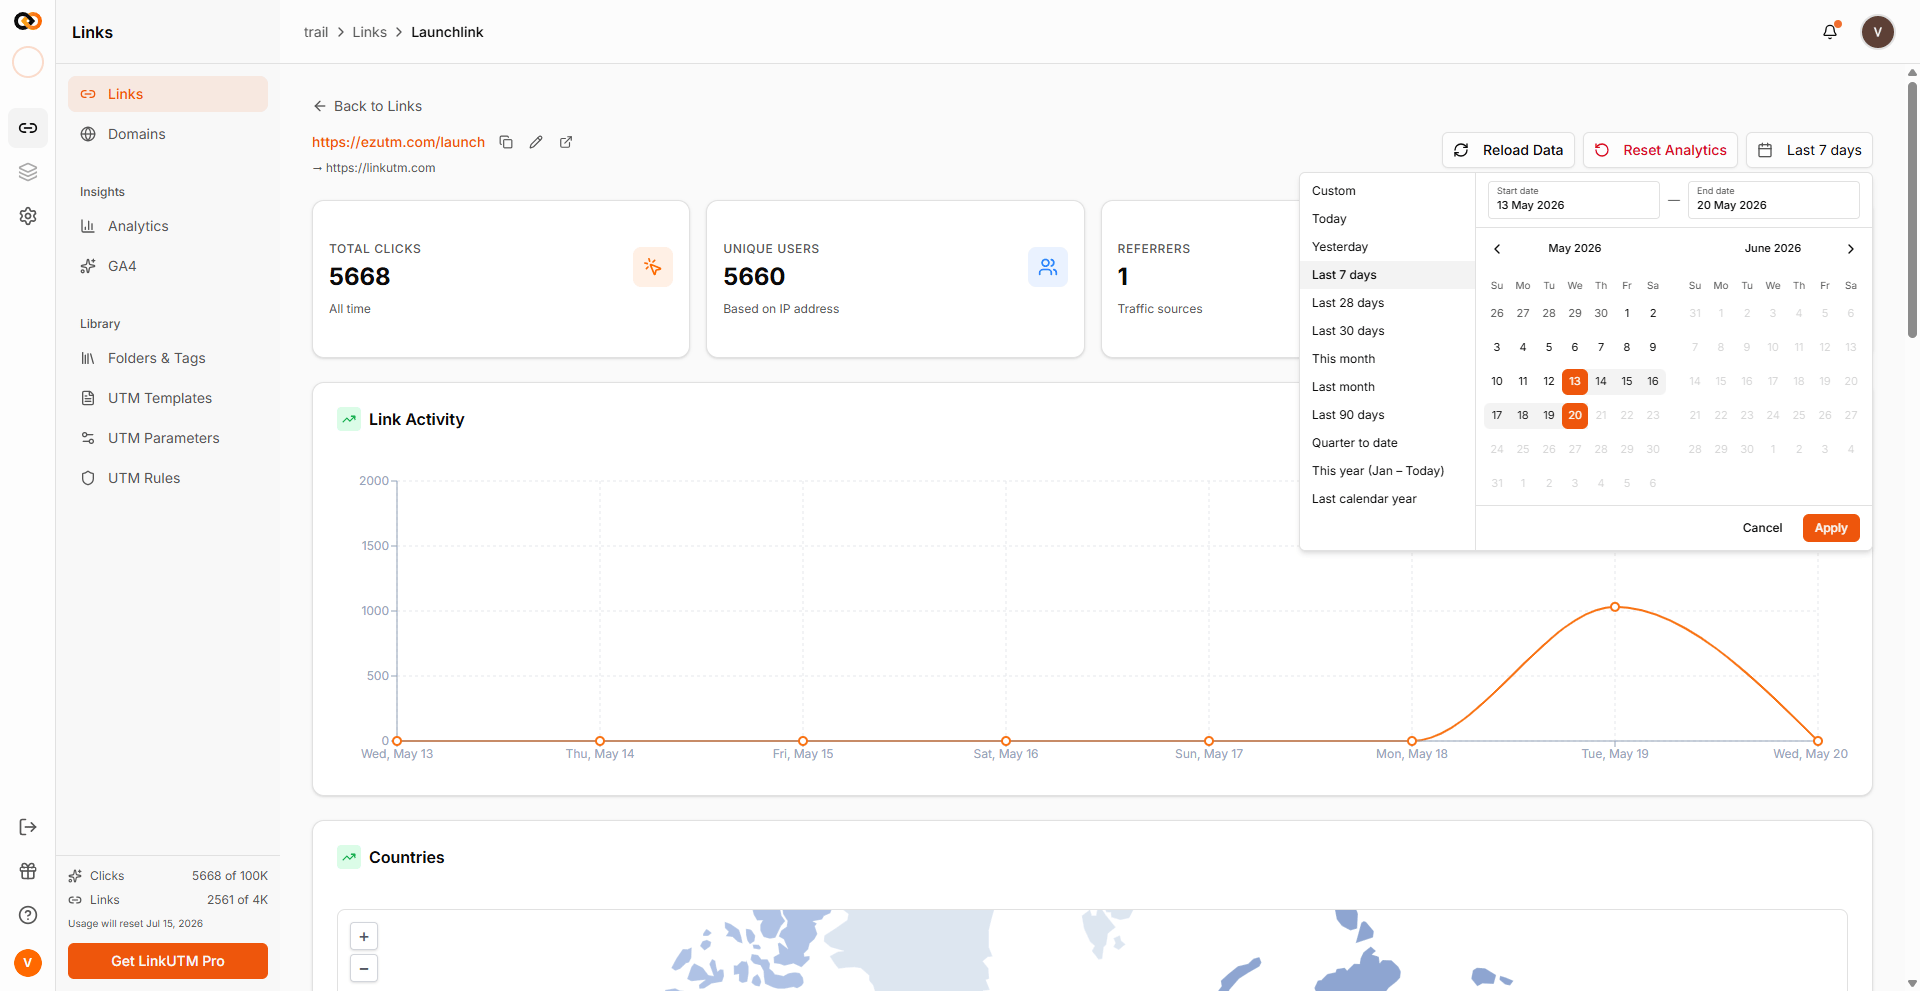
Common mistakes
Treating clicks as conversions
Treating clicks as conversions
A click is not a sale, signup, or page view. Pair with GA/Mixpanel/Amplitude (using the appended UTMs) for downstream events.
Counting bot traffic as humans
Counting bot traffic as humans
Some referrers are crawlers (Slack, Twitter, etc. when fetching OG previews). The system identifies common ones via UA pattern (Slack, WhatsApp, LinkedIn-bot, etc.) and labels them in the referrer column.
Querying beyond the retention window
Querying beyond the retention window
Each workspace has a retention window for click data. Queries that ask for older data are silently clipped to the start of the window.
Edge cases
Retention window. Queries are automatically capped to your plan’s retention window. Data beyond the window isn’t returned.
Reset analytics per link. A link’s click history can be wiped (resets click counter to 0 and deletes its
link_clicks rows). Use sparingly - the data is gone.